


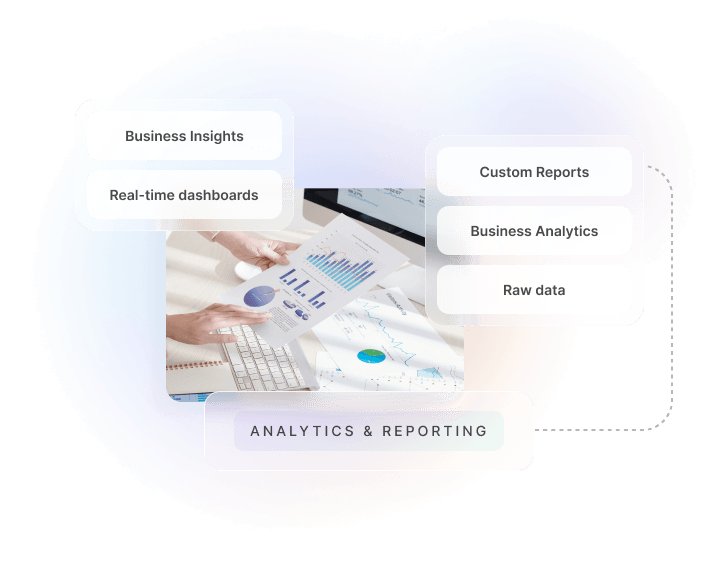
Analytics & Reporting
Transform raw data into actionable business insights. Real-time dashboards, custom reports, and business analytics help you understand your business and make informed decisions.
Complete Analytics Suite

Real-Time Dashboards
Monitor your business metrics as they happen with live-updating dashboards. Customise layouts to focus on what matters most to your team.

Trend Analysis
Identify patterns and trends in your data over time. Compare performance across periods to understand growth and seasonality.

KPI Tracking
Define and track key performance indicators across your organisation. Set targets and receive alerts when metrics deviate from goals.

Custom Reports
Build reports tailored to your business needs. Schedule automated delivery to stakeholders in their preferred format.

Predictive Insights
Leverage historical data to forecast future performance. Anticipate trends and make proactive business decisions.

Data Export
Export your analytics data in multiple formats including CSV, Excel, and PDF. Integrate with external BI tools for advanced analysis.
Built Into Every Hykmah Product
Every product in the Hykmah ecosystem is built on the same underlying platform. Analytics & Reporting is available across the entire product suite by default — every product includes built-in analytics tailored to its specific domain, all accessible from a unified data layer.
Control technician access to jobs, customer data, and pricing. Restrict based on territory, skill level, or assignment.

Isolate franchise data by location while giving corporate users visibility across the network. Role hierarchies mirror franchise structure.
Manage member data access for staff, volunteers, and board members with appropriate visibility levels per organisational role.


